1QFY2019 Result Update | Banking
July 24, 2018
HDFC Bank
Accumulate
CMP
`2,158
Performance Highlights
Target Price
`2,350
Particulars (` cr)
1QFY19
4QFY18
% chg (qoq)
1QFY18
% chg (yoy)
Investment Period
12 Months
NII
10,814
10,656
1.48
9,371
15.40
Pre-prov. profit
8,648
8,835
-2.12
7,519
15.01
Stock Info
PAT
4,601
4,799
-4.12
3,893
18.19
Source: Company, Angel Research
Sector
Banking
HDFC Bank delivered steady performance for Q1FY19, with PAT growth of 18.2%
Market Cap (` cr)
5,70,787
yoy. On the operating front, the bank reported 15.4% yoy growth in NII, however,
Beta
1.1
52 Week High / Low
2,219/1,685
the numbers disappointed on NIM front. NIM declined by 20bps on a sequential
Avg. Daily Volume
14,97,970
basis to 4.2%. The bank managed to reduce its expenses and brought down the
Face Value (`)
2
cost/income ratio from 41.7% in 1QFY18 to 40.9% in 1QFY19.
BSE Sensex
36,859
Healthy operating profit growth; Asset quality stable
Nifty
11,137
Reuters Code
HDBK.NS
During 1QFY19, the bank’s advances grew by 22% yoy, of which retail loan book
Bloomberg Code
HDFCB:IN
increased 25% yoy to constitute 54% of the total advances. The wholesale loans
inched up by 18% yoy. The net interest income during this period grew by 15.4%
yoy, which is not congruent to the advances growth. NIM compression was led by
Shareholding Pattern (%)
higher share of home loan (lower yield), lower yield on investment, low CASA
Promoters
20.9
growth and interest reversal in agri portfolio. Moreover, a slower rise in opex
MF / Banks / Indian Fls
17.1
aided lower cost/income by 75bps yoy to 40.9% in Q1FY19.
FII / NRIs / OCBs
52.0
Total deposits surged by 20% yoy and 2.2% qoq in 1QFY19. CASA deposits
Indian Public / Others
10.1
accounted for 41.7% of the total deposits.
On asset quality front, the bank continued to maintain strong asset quality with a
GNPA/NPA ratio of 1.33%/0.4% of loans. Total slippages for the quarter were
Abs. (%)
3m 1yr 3yr
`3,580cr vs. `2,790cr qoq.
Sensex
7.0
24.0
29.0
Outlook & Valuation: Credit growth beat the industry growth rate, driven by strong
HDFC Bank
12.0
14.0
92.0
retail business. The Strong liability franchise and healthy capitalisation provides
strong earning visibility. At the current market price, the bank is trading at 3.6x
FY20E ABV. We recommend a Buy rating on the stock, with a target price of
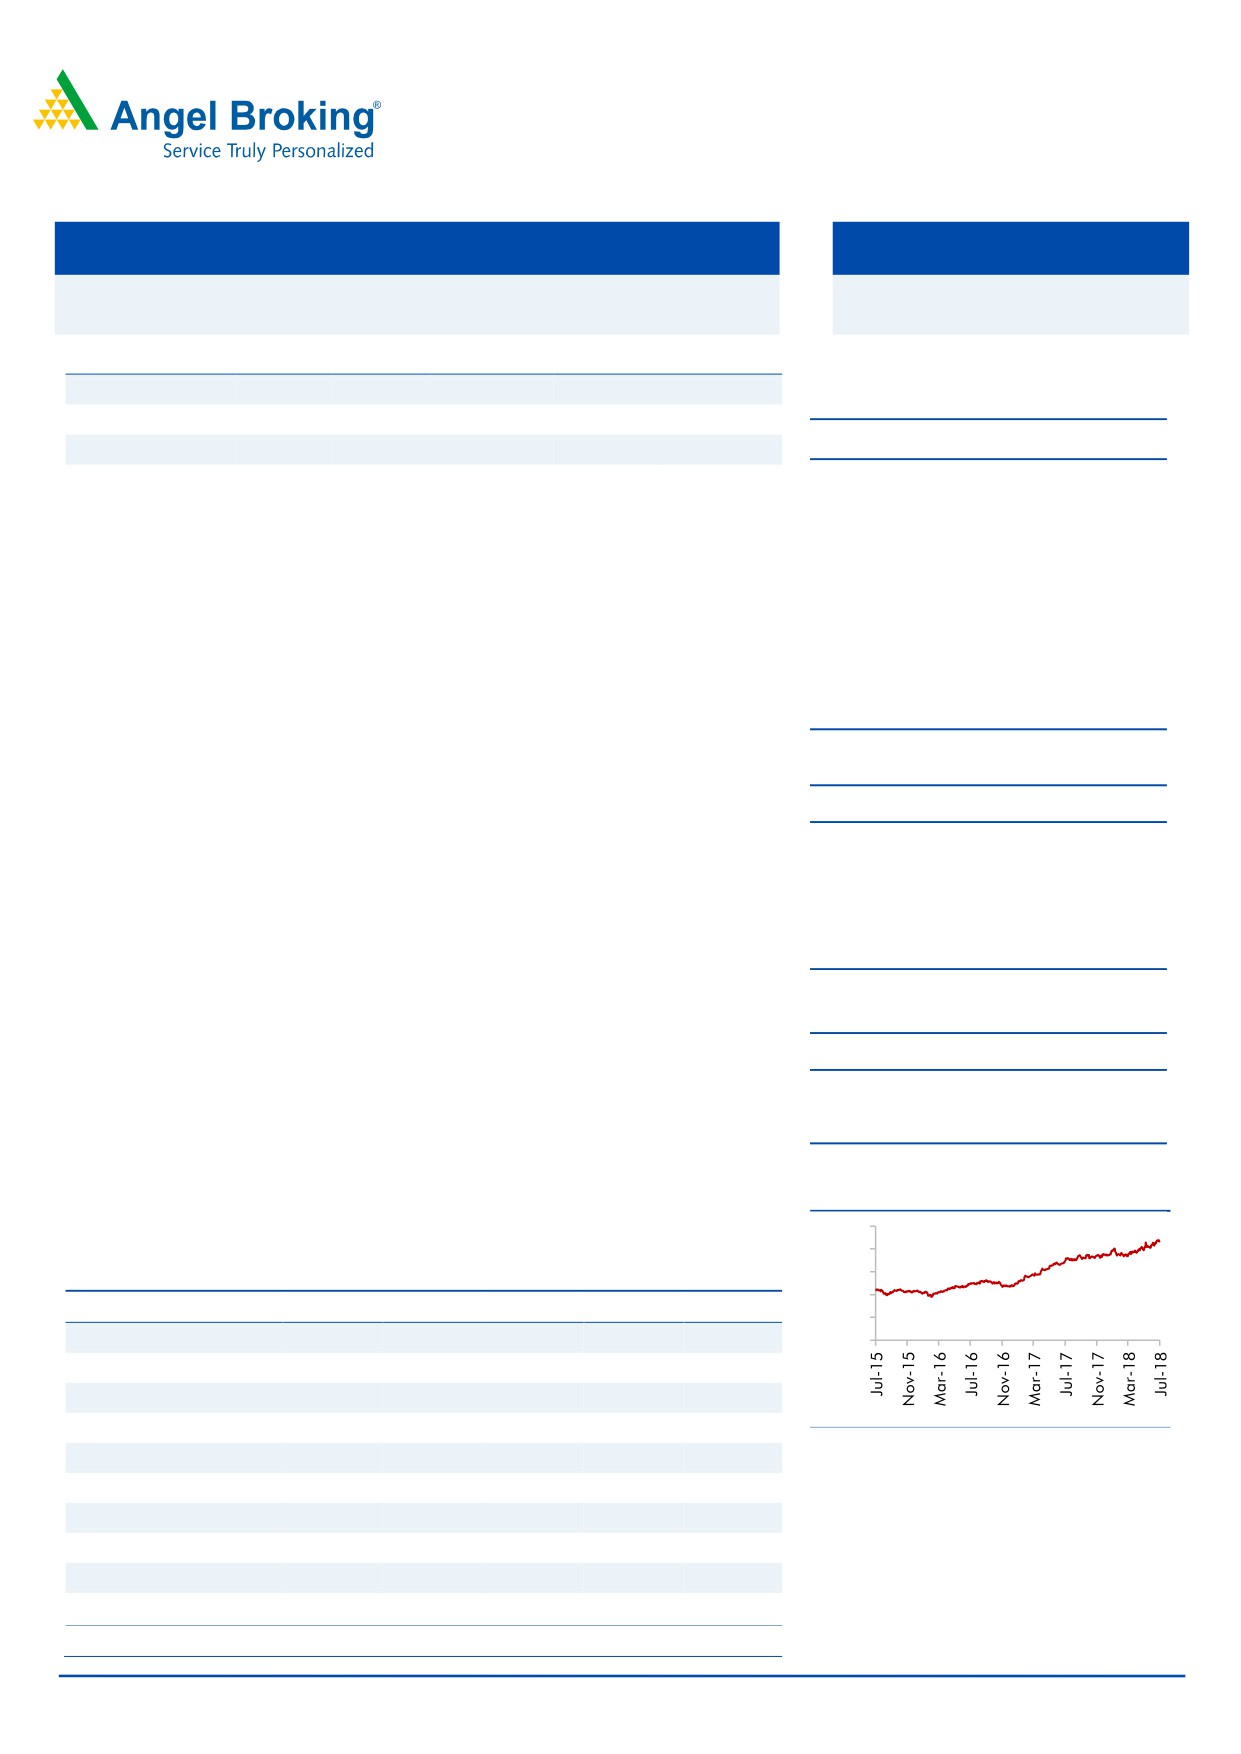
3-year price chart
`2,350/-.
2500
2000
Key financials (Standalone)
1500
1000
Y/E March (` cr)
FY16
FY17
FY18
FY19E
FY20E
500
NII
27,592
33,139
40,092
46,775
54,803
0
% chg
23.6
20.1
21.0
16.7
17.2
Net profit
12,296
14,549
17,486
21,080
25,741
% chg
21.2
18.3
20.2
20.6
22.1
Source: Company, Angel Research
NIM (%)
4.5
4.5
4.4
4.3
4.2
EPS ( Rs)
48.6
56.8
67.5
77.5
94.6
P/E (x)
44.3
38.0
31.9
27.8
22.8
P/ABV (x)
7.6
6.6
5.4
4.1
3.6
Jaikishan Parmar
RoA (%)
1.9
1.9
1.8
1.8
1.8
Research Analyst
RoE (%)
18.3
18.3
18.2
16.6
16.3
022 - 39357600 Ext: 6810
Note: CMP as of 23/7/18
Please refer to important disclosures at the end of this report
1
HDFC Bank | Q1FY2019 Result Update
Research Team Tel: 022 - 39357800
DISCLAIMER
Angel Broking Limited (hereinafter referred to as “Angel”) is a registered Member of National Stock Exchange of India Limited, Bombay
Stock Exchange Limited and Metropolitan Stock Exchange Limited. It is also registered as a Depository Participant with CDSL and
Portfolio Manager and Investment Adviser with SEBI. It also has registration with AMFI as a Mutual Fund Distributor. Angel Broking
Limited is a registered entity with SEBI for Research Analyst in terms of SEBI (Research Analyst) Regulations, 2014 vide registration
number INH000000164. Angel or its associates has not been debarred/ suspended by SEBI or any other regulatory authority for
accessing /dealing in securities Market. Angel or its associates/analyst has not received any compensation / managed or co-managed
public offering of securities of the company covered by Analyst during the past twelve months.
This document is solely for the personal information of the recipient, and must not be singularly used as the basis of any investment
decision. Nothing in this document should be construed as investment or financial advice. Each recipient of this document should
make such investigations as they deem necessary to arrive at an independent evaluation of an investment in the securities of the
companies referred to in this document (including the merits and risks involved), and should consult their own advisors to determine
the merits and risks of such an investment.
Reports based on technical and derivative analysis center on studying charts of a stock's price movement, outstanding positions and
trading volume, as opposed to focusing on a company's fundamentals and, as such, may not match with a report on a company's
fundamentals. Investors are advised to refer the Fundamental and Technical Research Reports available on our website to evaluate the
contrary view, if any
The information in this document has been printed on the basis of publicly available information, internal data and other reliable
sources believed to be true, but we do not represent that it is accurate or complete and it should not be relied on as such, as this
document is for general guidance only. Angel Broking Limited or any of its affiliates/ group companies shall not be in any way
responsible for any loss or damage that may arise to any person from any inadvertent error in the information contained in this report.
Angel Broking Limited has not independently verified all the information contained within this document. Accordingly, we cannot
testify, nor make any representation or warranty, express or implied, to the accuracy, contents or data contained within this document.
While Angel Broking Limited endeavors to update on a reasonable basis the information discussed in this material, there may be
regulatory, compliance, or other reasons that prevent us from doing so.
This document is being supplied to you solely for your information, and its contents, information or data may not be reproduced,
redistributed or passed on, directly or indirectly.
Neither Angel Broking Pvt. Limited, nor its directors, employees or affiliates shall be liable for any loss or damage that may arise from
or in connection with the use of this information.
Disclosure of Interest Statement
HDFC Bank
1. Financial interest of research analyst or Angel or his Associate or his relative
No
2. Ownership of 1% or more of the stock by research analyst or Angel or associates or relatives
No
3. Served as an officer, director or employee of the company covered under Research
No
4. Broking relationship with company covered under Research
No
July 24, 2018
5